

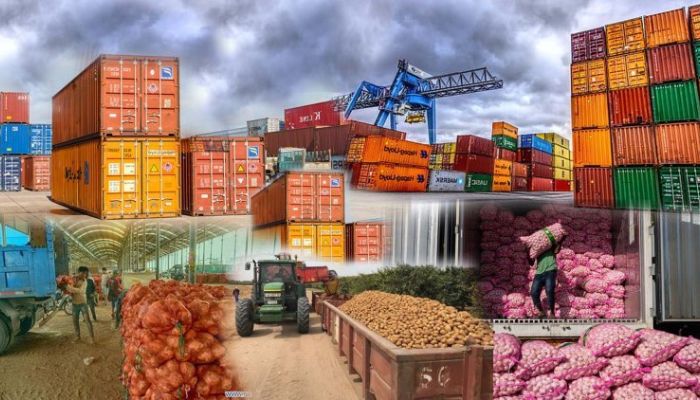
Nigeria’s merchandise trade surplus rose to ₦12.60 trillion in the second quarter of 2026, more than doubling from the corresponding period of 2025, as exports increased while imports declined year-on-year.
The National Bureau of Statistics (NBS), in its Foreign Trade in Goods Statistics Report for Q2 2026, said the country’s merchandise trade balance stood at ₦12,596.86 billion, representing a 101.32 percent increase compared with the same quarter of 2025.
The report showed that Nigeria’s total merchandise trade stood at ₦41.44 trillion during the quarter, representing a 5.61 percent increase from ₦39.24 trillion recorded in Q2 2025 and a 19.13 percent rise from ₦34.79 trillion recorded in Q1 2026.
Total exports increased to ₦27.02 trillion in Q2 2026, up by 18.77 percent from ₦22.75 trillion recorded in the corresponding quarter of 2025.
The figure also represented a 27.64 percent increase from ₦21.17 trillion recorded in the first quarter of 2026. Exports accounted for 65.20 percent of Nigeria’s total merchandise trade during the period.
Crude oil remained the country’s leading export commodity, valued at ₦12.91 trillion, representing 47.79 percent of total exports.
However, non-crude oil exports collectively accounted for a larger share, valued at ₦14.11 trillion or 52.21 percent of total exports. Non-oil products contributed ₦3.73 trillion, representing 13.80 percent of total exports.
Crude oil exports increased by 7.93 percent from ₦11.97 trillion in Q2 2025 and by 15.28 percent from ₦11.20 trillion in Q1 2026.
READ ALSO: NBS, UNICEF Launch Multiple Indicator Cluster Survey
Other oil products also recorded strong growth, rising to ₦10.38 trillion, an increase of 34.08 per cent from Q2 2025 and 53.05 per cent from the preceding quarter.
Imports Decline
In contrast, total imports stood at ₦14.42 trillion, representing a 12.55 percent decline from ₦16.49 trillion recorded in Q2 2025.
However, imports increased by 5.91 percent compared with ₦13.62 trillion recorded in Q1 2026. Imports accounted for 34.80 percent of total merchandise trade.
China remained Nigeria’s largest source of imports, accounting for 41.02 percent of total imports, with goods valued at ₦5.92 trillion.
The United States followed with ₦1.01 trillion, representing 6.97 percent; India accounted for ₦924.46 billion or 6.41 percent; the Netherlands supplied ₦409.81 billion or 2.84 percent, while Germany accounted for ₦395.87 billion or 2.74 percent.
The leading import categories were machinery and transport equipment, valued at ₦5.46 trillion, chemicals and related products at ₦2.51 trillion, and manufactured goods at ₦1.87 trillion.
Meanwhile, India emerged as Nigeria’s leading export destination in Q2 2026, receiving goods worth ₦3.29 trillion, representing 12.17 percent of total exports.
Spain followed with ₦1.98 trillion, the Netherlands with ₦1.90 trillion, the United States with ₦1.73 trillion and Togo with ₦1.50 trillion.
The five countries collectively accounted for 38.51 percent of Nigeria’s total exports during the quarter.
Nigeria’s exports to African countries stood at ₦6.65 trillion, while imports from the continent amounted to ₦1.10 trillion.
Togo was Nigeria’s largest export destination in Africa, with exports valued at ₦1.50 trillion, followed by South Africa at ₦1.34 trillion, Côte d’Ivoire at ₦1.22 trillion, Ghana at ₦461.36 billion and Egypt at ₦455.81 billion.
Together, the five countries accounted for 74.75 percent of Nigeria’s exports to Africa.
Within West Africa, Nigeria exported goods worth ₦3.82 trillion and imported goods valued at ₦280.66 billion. Togo and Côte d’Ivoire were the leading export partners, followed by Ghana, Senegal and Benin.
Agricultural Exports
Despite the overall increase in exports, agricultural exports recorded a sharp decline during the quarter.
The value of agricultural exports fell to ₦802.99 billion, representing a 36.09 percent decline from ₦1.26 trillion recorded in Q2 2025 and a 31.51 percent decline from ₦1.17 trillion in Q1 2026.
Cashew nuts in shell remained the leading agricultural export at ₦268.62 billion, followed by standard-quality cocoa beans at ₦154.31 billion and sesame seeds at ₦96.03 billion.
Agricultural imports, however, increased to ₦1.20 trillion, up 1.63 percent from Q2 2025 and 45.43 percent from Q1 2026.
Solid Minerals, Raw Materials
The report also recorded significant growth in exports of solid minerals and raw materials.
Solid mineral exports rose to ₦146.91 billion, representing a 90.03 percent increase from Q2 2025 and 42.91 percent growth from Q1 2026.
Raw material exports recorded an even stronger increase, rising to ₦2.31 trillion, up 181.24 percent from ₦819.72 billion in Q2 2025 and 50.31 percent from ₦1.53 trillion in Q1 2026.
The NBS said the leading raw material export was urea, valued at ₦1.07 trillion, exported to the United States, while non-monetary gold in powder form exported to Switzerland was valued at ₦73.09 billion.
Maritime Transport
The report further showed that maritime transport remained the dominant mode for Nigeria’s international merchandise trade.
Exports transported by sea were valued at ₦26.75 trillion, accounting for 98.99 per cent of total exports. Maritime transport also handled imports worth ₦13.66 trillion, representing 94.74 per cent of total imports.
Apapa Port handled the largest share of exports, with goods valued at ₦19.07 trillion, representing 70.57 percent of total exports.
Lekki Deep Sea Port followed with ₦5.03 trillion, representing 18.62 percent.
On the import side, Apapa also recorded the largest value at ₦6.46 trillion, followed by Tin Can Island Port at ₦2.17 trillion and Lekki Deep Sea Port at ₦1.61 trillion.